Conditional Access Report Mode Reporting

This is a writeup of a session that I gave at WP Ninja Summit 2022
You must have Conditional Access!
If you don’t already have it. Seriously! As soon as possible. It’s the most effective way to prevent successful phishing attacks against your Microsoft 365 services like Teams, Exchange Online and OneDrive. If you don’t have CA or MFA anyone can login with username and password.
But rolling out MFA is a difficult task which involves a lot of user eductation. But with Conditional Access you can easily use other grant controls as a second factor such as a managed/compliant device or a trusted network. If you’re using Azure AD Connect you can easily enable Azure AD Hybrid Join and use these devices a second factor / grant control.
Sound’s easy right? The problem is that it is easy but not problem free. In this post I’m going to walk you through the problems you may face when you use device information as a grant control. And I will show you how you can find these issues before enforcing the policy. To achieve that I created a dashboard that you can find on my GitHub. If you want to understand it, you can read this post. Or just get the dashboard.
In this example I will use Windows as an example but the provided tools apply to any operating system. I’m assuming you know how to create policies and the issues that arise with that.
Prerequisites
Whenever you want to use the device as a second factor the most important prerequisite is that you use a supported configuration. Azure AD needs to obtain the device ID to check further grant controls. In Windows this means that you have to fulfill one these prerequisites:
- Use M365 Apps
- Use Edge
- Use Chrome with the Windows Accounts extension
- Use Firefox with Windows SSO enabled
That’s it. If your using Edge only you will like have very few problems.
Create a policy
For starters we will use a policy that simply checks for a compliant device. The scoped user will be able to access the app if the device is recognized and is compliant. So what can go wrong?
- Device is not compliant
- Device not detected
An undetected device can have three reasons
- You’re using an unsupported browser
- You use a supported browser but with insufficient config (applies to Chrome and Firefox)
- AAD / Intune Device do not match. This happens from time to time.
You already see that there are a lot of things that can go wrong especially if you multiply that with 1000 or 10.000 users. So how will you know that you don’t break anything if you enforce the policy?
Enable Reporting Mode
Before you enable the policy set it into report mode. To each Sign In Log Event in the Azure AD portal there will be a sepearte Report Mode tab created that shows you the outcome of policies in report mode. It can have four states:
- Successful
- Failure
- Interrupted, which means MFA will pop up once it is in production
- Not Applied
Cool right? The issue that arises is: How do I know that it will work for all my users? Do I have to click through every Sign in Log? That seems like a very bad idea. And it actually is.
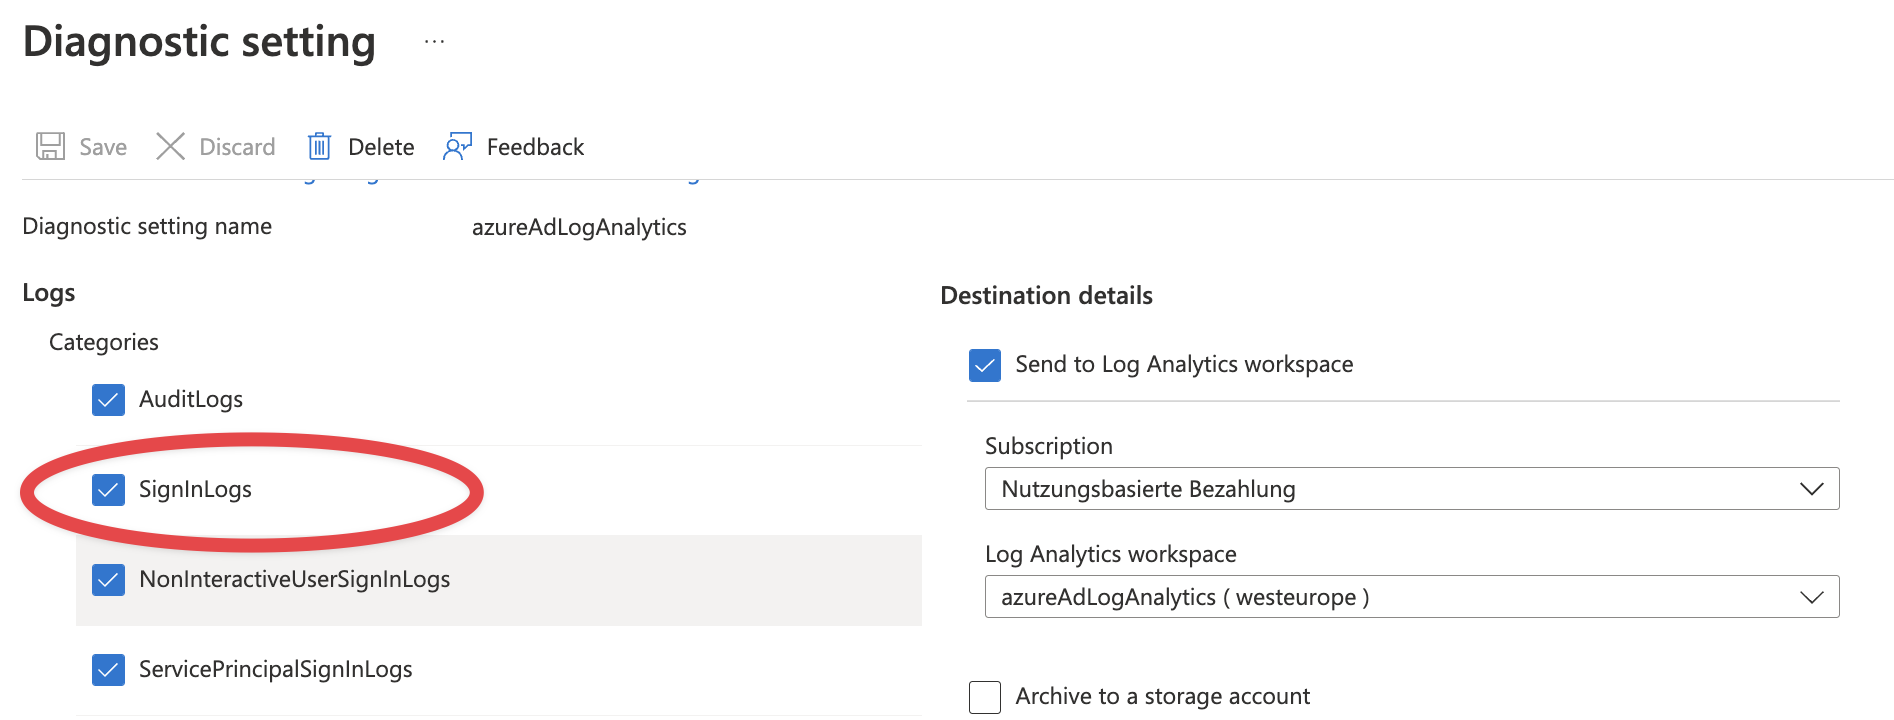
To report this at scale you will have to ship your Sign In Logs to a Log Analytics workspace. In Azure AD Go to Sign In Logs -> Diagnostic settings and export.
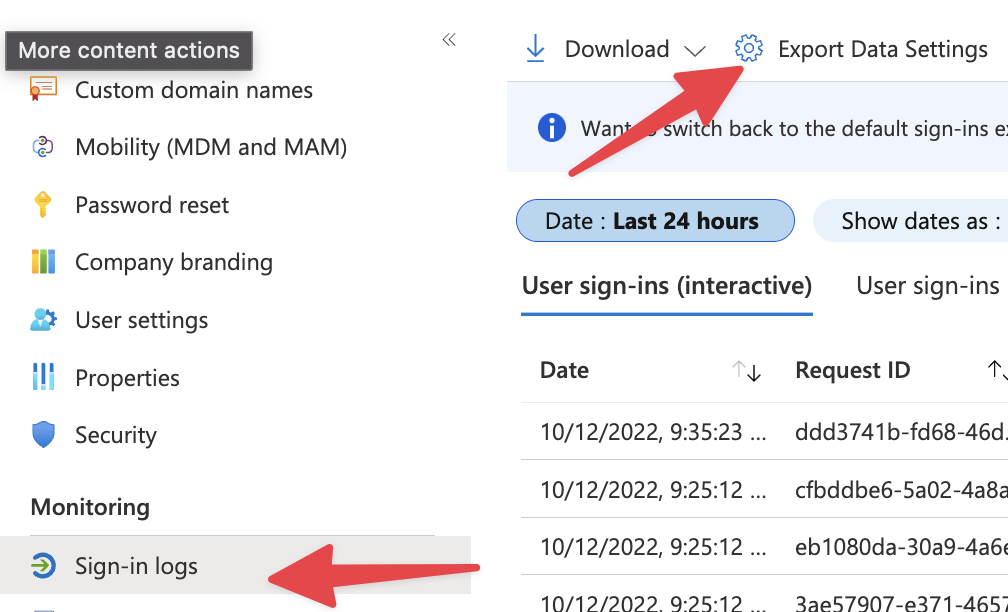
Start with Sign in Logs, but my recommendation is to Export all the logs and also keep them for minimum 90 days. It will cost you some money but will help you if you will have an incident - which is statistically only a matter of time.
The Logs
So let’s see what’s written in the logs. We will use KQL to have a look at the logs. Go to the Log Analytics Workspace you created, select Logs and Double Click on sign in logs. It will copy the table name into the query window. Click Run.
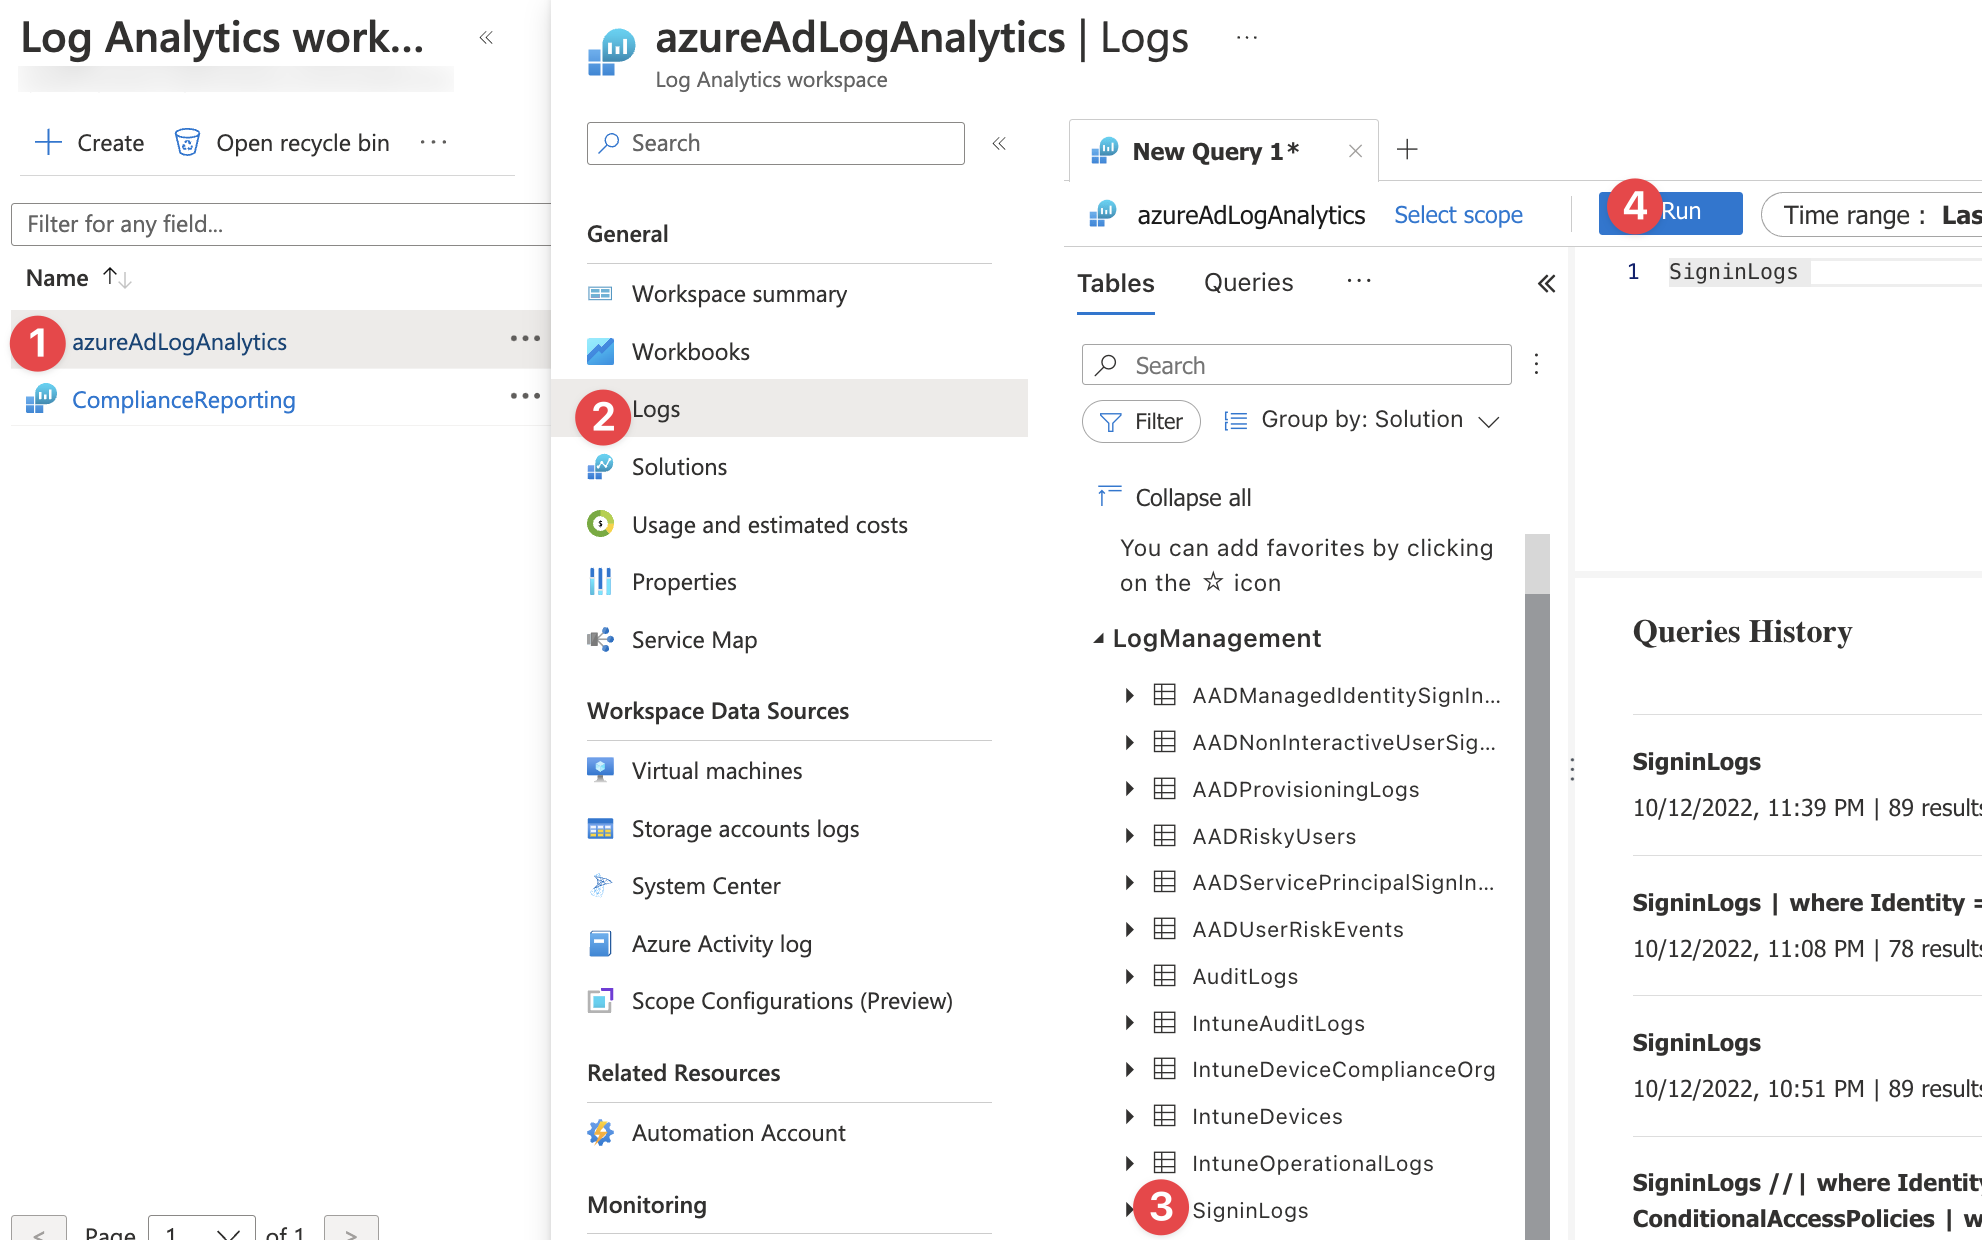
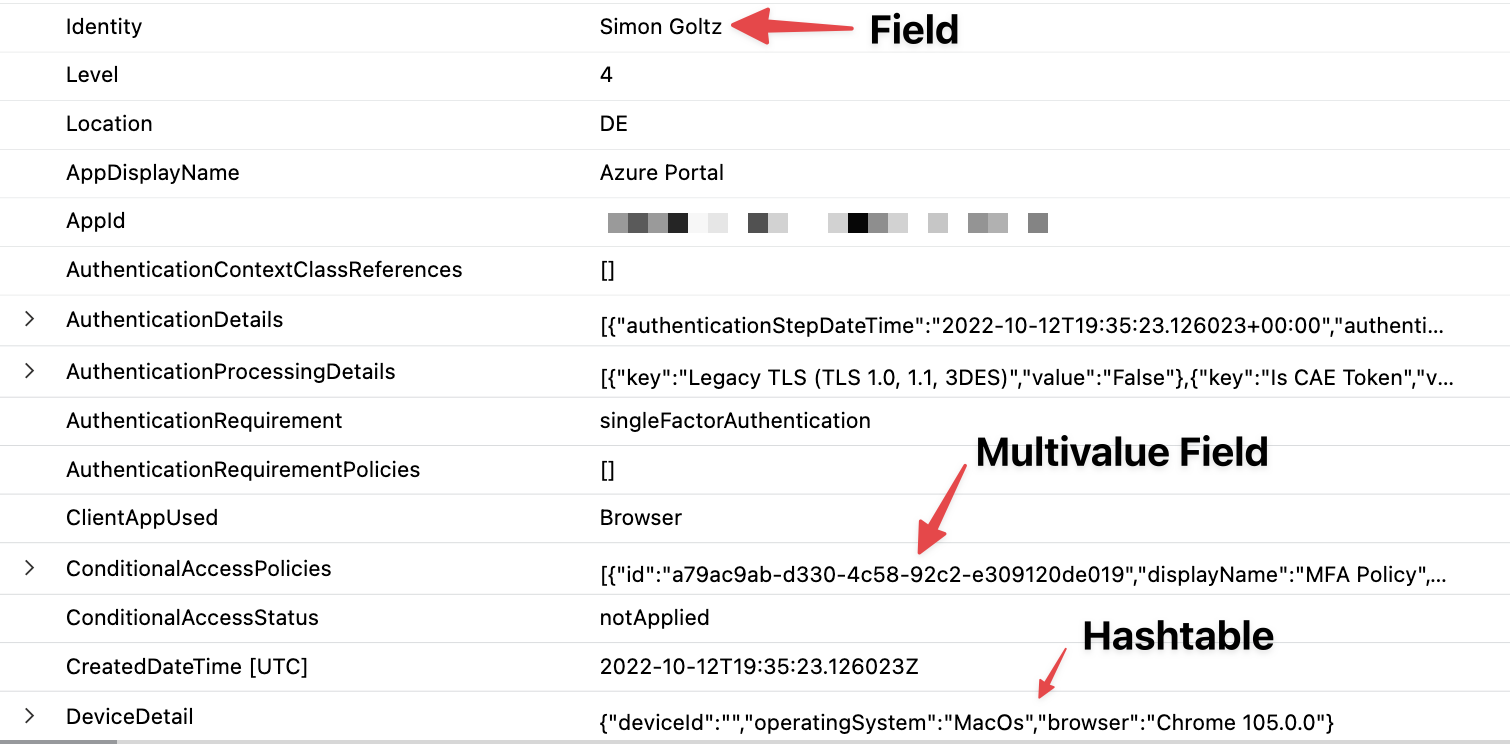
Congratulations, you have run your first KQL query. It will output the entire table for the given timespan. Let’s have a look at the logs. The logs contain a ton of metadata that is not relevant for us, but for Azure AD. Each row is a Sign In and it contains fields inside. These can be fields of the type Name: value e.g. Identity: Simon Goltz There are also fields that contain multiple fields. They are called hashtables. Example: DeviceDetails. And there are multivalue fields that contain multiple hashtables. We will need all of this to query the reports.
KQL
Kusto Query Language is your friend when you want to query Log Analytics. You need to learn it. It’s in every MS Learning path and the key to get the most of all MS Security Products like Defender for Endpoint. And it’s actually fun to work with. It’s blazingly fast as Microsoft runs the required infrastructure for you. And you can amazing things with a few lines of code. I’m going to show you now.
To report our policy we will do three things:
- Report the policy: Which results does it have?
- Sharpen the view: Why does it fail?
- Report at scale
So let’s dive in
Report the policy
First thing is to look for sign ins that actually have Condtional Access Policies applied with where ConditionalAccessPolicies != "[]" The query translates to. Show me the policies where the ConditionalAccessPolicies field is not empty. Once we have that the second step is to filter for the actual policy we want to report. To be able to do that we need to mv-expand ConditionalAccessPolicies field. It will create a seperate row for every contional access policy in your tenant for every sign in. You will see that in the timestamps.
Once this is done we can filter for the policy we want to report on where ConditionalAccessPolicies.displayName == "YOUR POLICY NAME". Since we want to know the result it’s good to bring that to the top view. We will create a new column with the name Result using extend Result = ConditionalAccessPolicies.result. It will show a nice table with all the results for your policy. Use project to keep the colums you need like project TimeGenerated, Identity, AppDisplayName, Result
In KQL you combine all of these queries using a pipe | as shown below.
|
|
The last row counts all the results. If you have 1000 Sign Ins per day it’s still too much data for you to process, so let KQL count for you.

Sharpen the view
Next we want to focus on the things that are not working. So we filter for the Result column that we just created. where Result == "reportOnlyFailure" Then we need to ask for the reasons why a policy might fail. Therefore we will extend our table with multiple fields extend DeviceId = DeviceDetail.deviceID, Compliant = DeviceDetail.isCompliant, Browser = DeviceDetail.browser and integrate that in our project row. We also add ClientAppUsed because this includes Office Apps in case there is an issue, but I don’t see that very often.
|
|

With this result you can call the users that have issues and fix their device.
Report at scale
Currently we have a very limited view on the results. We will now get the results on a daily basis for the past 30 days - if you have historic data.
First is to get the expand the timespan we query. Then we can reuse our first query with little adjustments to the summarization. Note that I also changed the way to query for Result. Here I use and array and query if Result equals one aof the values in the array.
|
|
The key here is the count() by bin(TimeGenerated, 1d). What does it do? bin groups values in buckets and rounds them to the second argument. We use it to round all timestamps in TimeGenerated to the according day. This results in a table like this.
You can see the successes and failures per day. But it’s still difficult to make sense of it. Our brain is not made to process this kind of data. To help us figure stuff out we will use the drawing function of KQL with render timechart.

BOOM! I really like that. With this information you can continiue to implement Conditional Access.
Enforce Policy
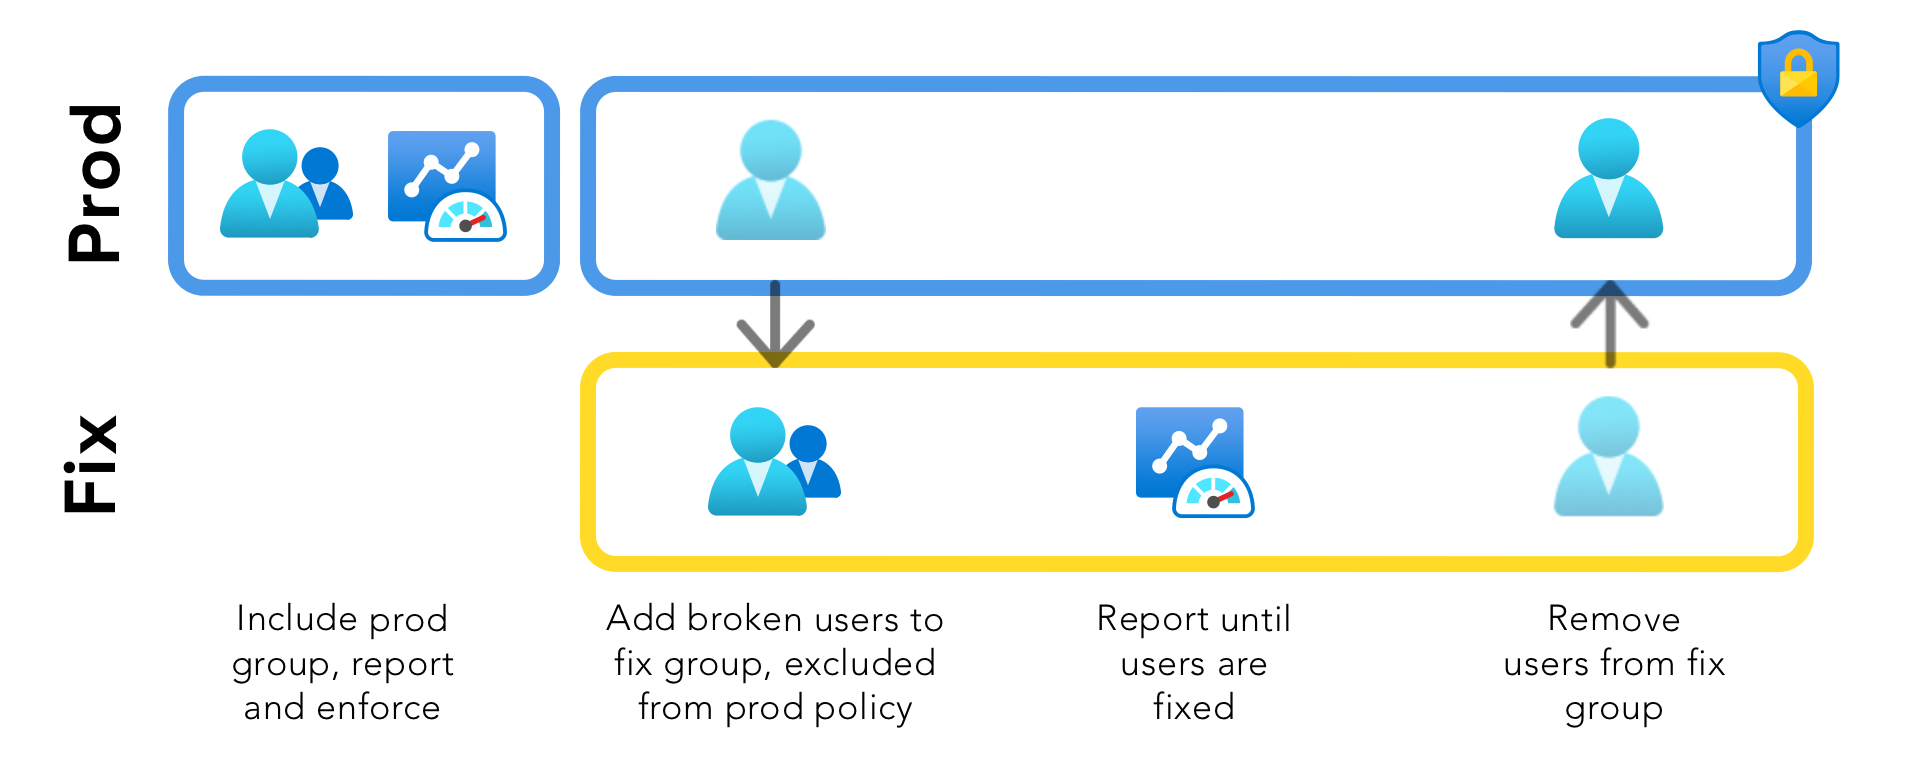
Perfect is the enemy of good, so please enable Conditional Access for users where it’s working. To do that you have to create a group with the broken users. Exclude this group from the policy you want to enforce. Create a duplicate policy in report mode that is onyl scoped to the “fix” and continue fixing these users. Below is a picture that hopefully clarifies the concept.
Dashboard
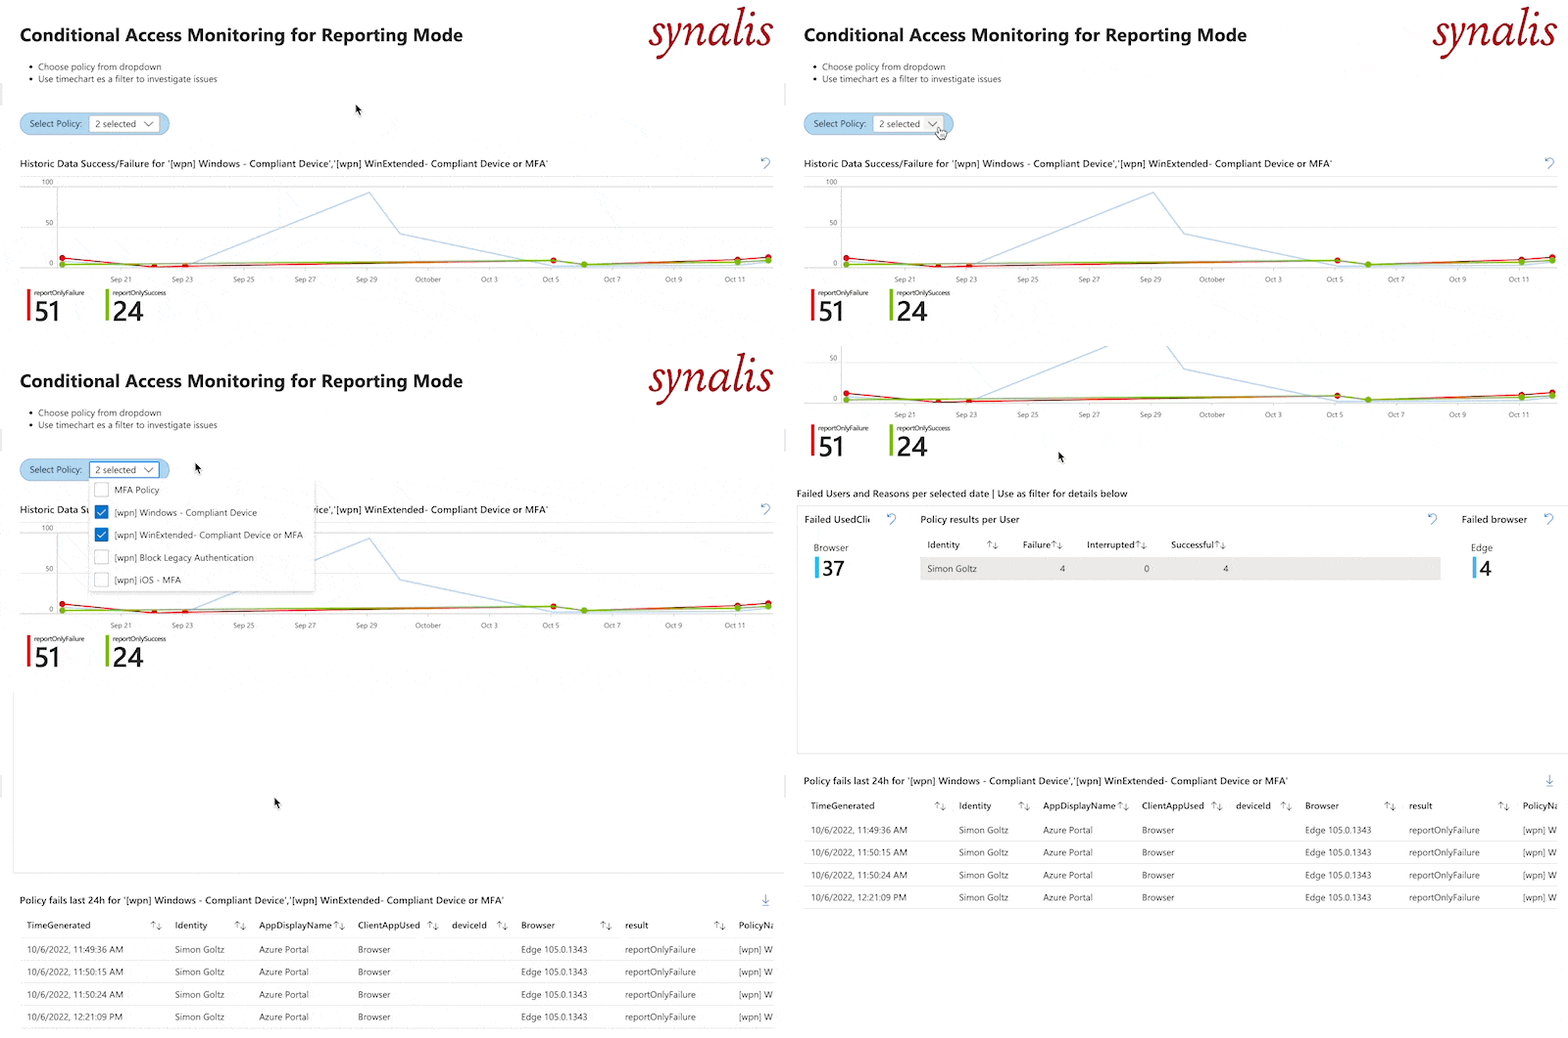
As I mentioned - I built a dashboard for you. You can get in on my GitHub. It works only for policies in report mode. Basis is the timechart we created. You can click on any date to see the users where the policy was failing. The selected date will be fed into the second block where it shows you the affected Identities, Browsers and apps. You can click on those to further filter down in the third block or use it without filters. I will do another blog post on filtering in dashboards.
