How to monitor ZPA App Connector connection status

Quality in IT-Operations is based on proper testing and also proper monitoring, especially of critical components. ZPA App connectors are one of those and there are many ways to monitor the health of the server or the service itself e.g. using SNMP. One thing that I was looking for quite a while was how to monitor the connection of the App Connector to ZPA Cloud. It could be lost although server and service are fine. Although they come always as a pair you want to be notified if one of them breaks.
Thanks to the ZPA API this is now possible. We use a script that will poll the API and will return the connection status of the App Connector. I will show you how to do it with PowerShell. Please adapt it to your needs.
How To
Get the API Key
First of all you have to optain an API Key from the ZPA Portal. Sadly there are no read only keys until now in the API. In your Administration Menu you find the public API.

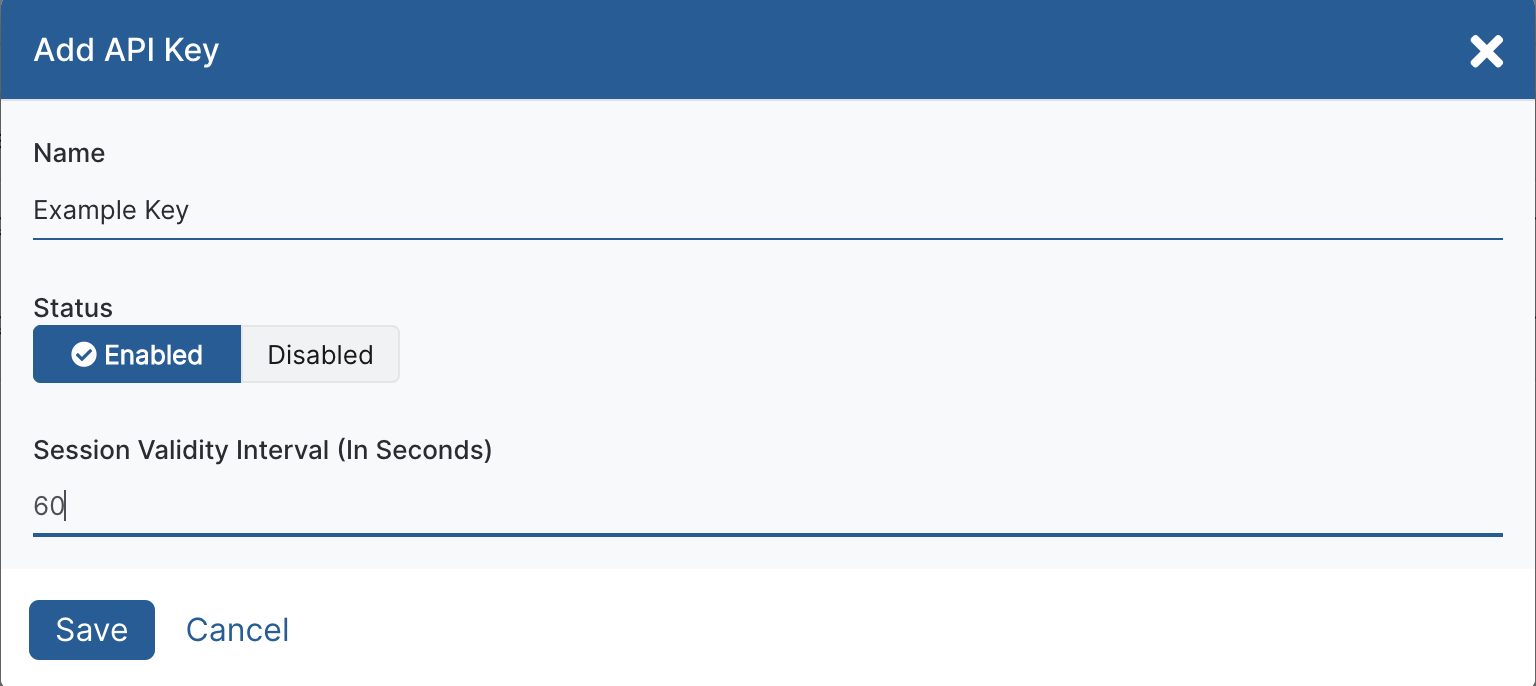
Create a new key. You only have to specify the name. You can reduce the session duration to 60 seconds. We will authenticate on each script run so you don’t have to leave the session open.

Zscaler will generate Client ID and Client Secret for you. Both cannot be changed. The Client Secret will only be shown once. Please copy and Keep it secret.
If you want to test you can login to ZPA API PORTAL for troubleshooting. Next is authentication.
Authenticate
The authentication against ZPA API is fairly easy.
- Authenticate with Client ID and Secret
- Get a Token
- Use Token for Authentication of your API Calls
It is described in the ZPA Help. Zscaler also provided an python example which we will adapt to powershell.
From the python example we learn that the ZPA API requires a webrequest of Content-Type:application/x-www-form-urlencoded which it the default method of PowerShell. The body is a hashtable of client_id and client_secret.
To lets start with that:
|
|
Your password should be retreived from an encrypted file. You could easily do that with PowerShell. PowerShell encryption is based on the user and the machine encrypting the file. No other user can access the file and the user cannot move it to another machine.
After that we authenticate against the Zscaler API endpoint https://config.private.zscaler.com/signin. The function returns a JSON with the token we need.
|
|
Perfect. Next step is to find the connector IDs of the connectors we want to monitor.
Find your Connectors
For my monitoring system (PRTG) I want to retreive the status of each connector seperately. The ZPA API reference lets us query connectors directly by calling /mgmtconfig/v1/admin/customers/{customerId}/connector/{connectorId}. The {customerId} can be copied from the ZPA Portal in the API section. What we don’t know yet is the {connectorId}. This can be retreived by calling /mgmtconfig/v1/admin/customers/{customerId}/connector.
So let’s do that. First we have to build our request header witht the token. We will use that to call the API with Invoke-WebRequest.
|
|
This again returns a JSON with a list of all connectors. I removed all the parts that we don’t need, the full list can be found in the API reference.
|
|
The value controlChannelStatusist the one we need. It can have three values which is described in the model section of the reference.
Expected values:
- UNKNOWN
- ZPN_STATUS_AUTHENTICATED
- ZPN_STATUS_DISCONNECTED
So if the controlChannelStatus returns ZPN_STATUS_AUTHENTICATED everything is fine. Otherwise someone should be notified. As you can see the list provides the details of all connectors in one JSON. You can easily process the data from here as per your needs.
Get the status
However I need the status for one connector. So I copy the id of the connector and create another request. Later the IDs will be provided by my monitoring system.
|
|
That’s it.
Report
You can now report the status of $connector.controlChannelStatus to your monitoring system and let it notify you.
Let me know
I’m not sure if this is the best way but I like it. If you found another solution let me know. This script is also on Github.
Appreciation
Photo by Markus Spiske on Unsplash